Structure charts
Structure chart software, drawn from your data
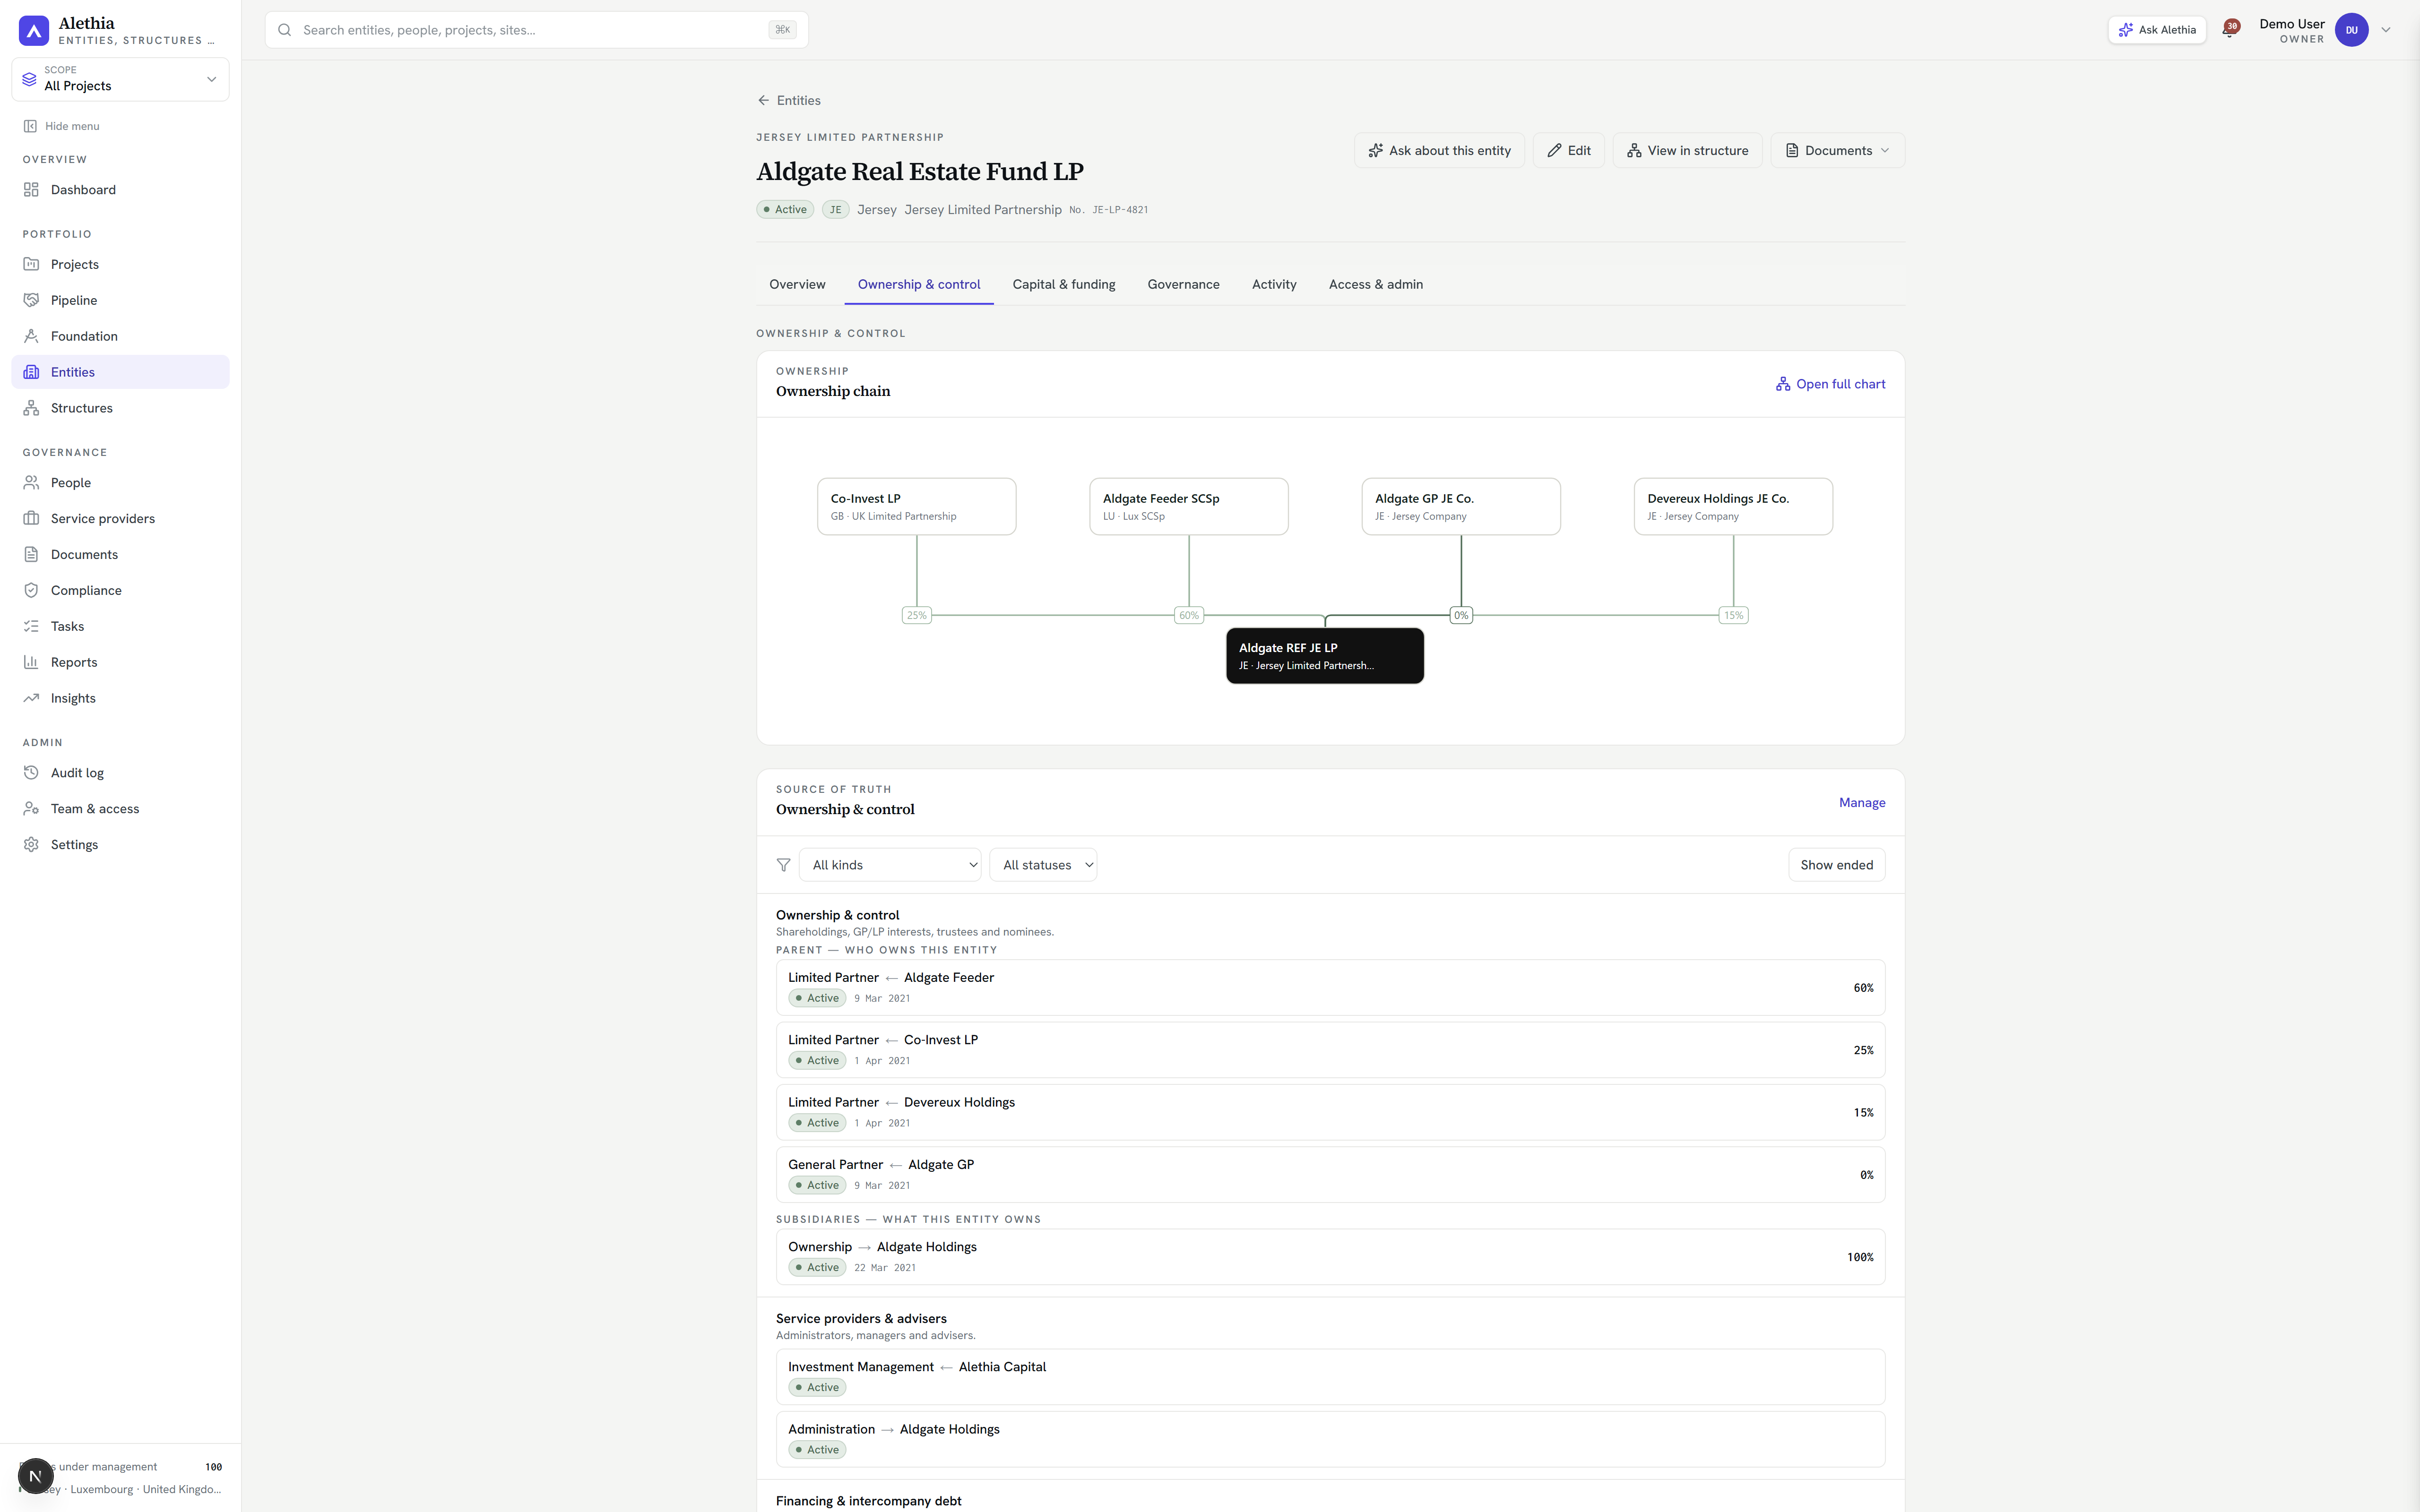
The chart is a view of the register. Every box is an entity record and every line an interest or an agreement held against it.
Legal, voting and economic bases · Drawn as at any date · Application servers in Vercel lhr1
What it holds
The chart is a view of the register.
Each interest is a record with its holder, its basis, its percentage and its effective date. The chart is drawn from those records, so adding an entity or changing a shareholding changes the chart with no second copy to keep in step. Proposed, dormant and sold entities are shown as such, and ended interests can be shown or left out.
- Ownership by legal, voting and economic basis
- Multi-parent holdings drawn as they are held
- Management and financing agreements as their own line styles
Beneficial ownership
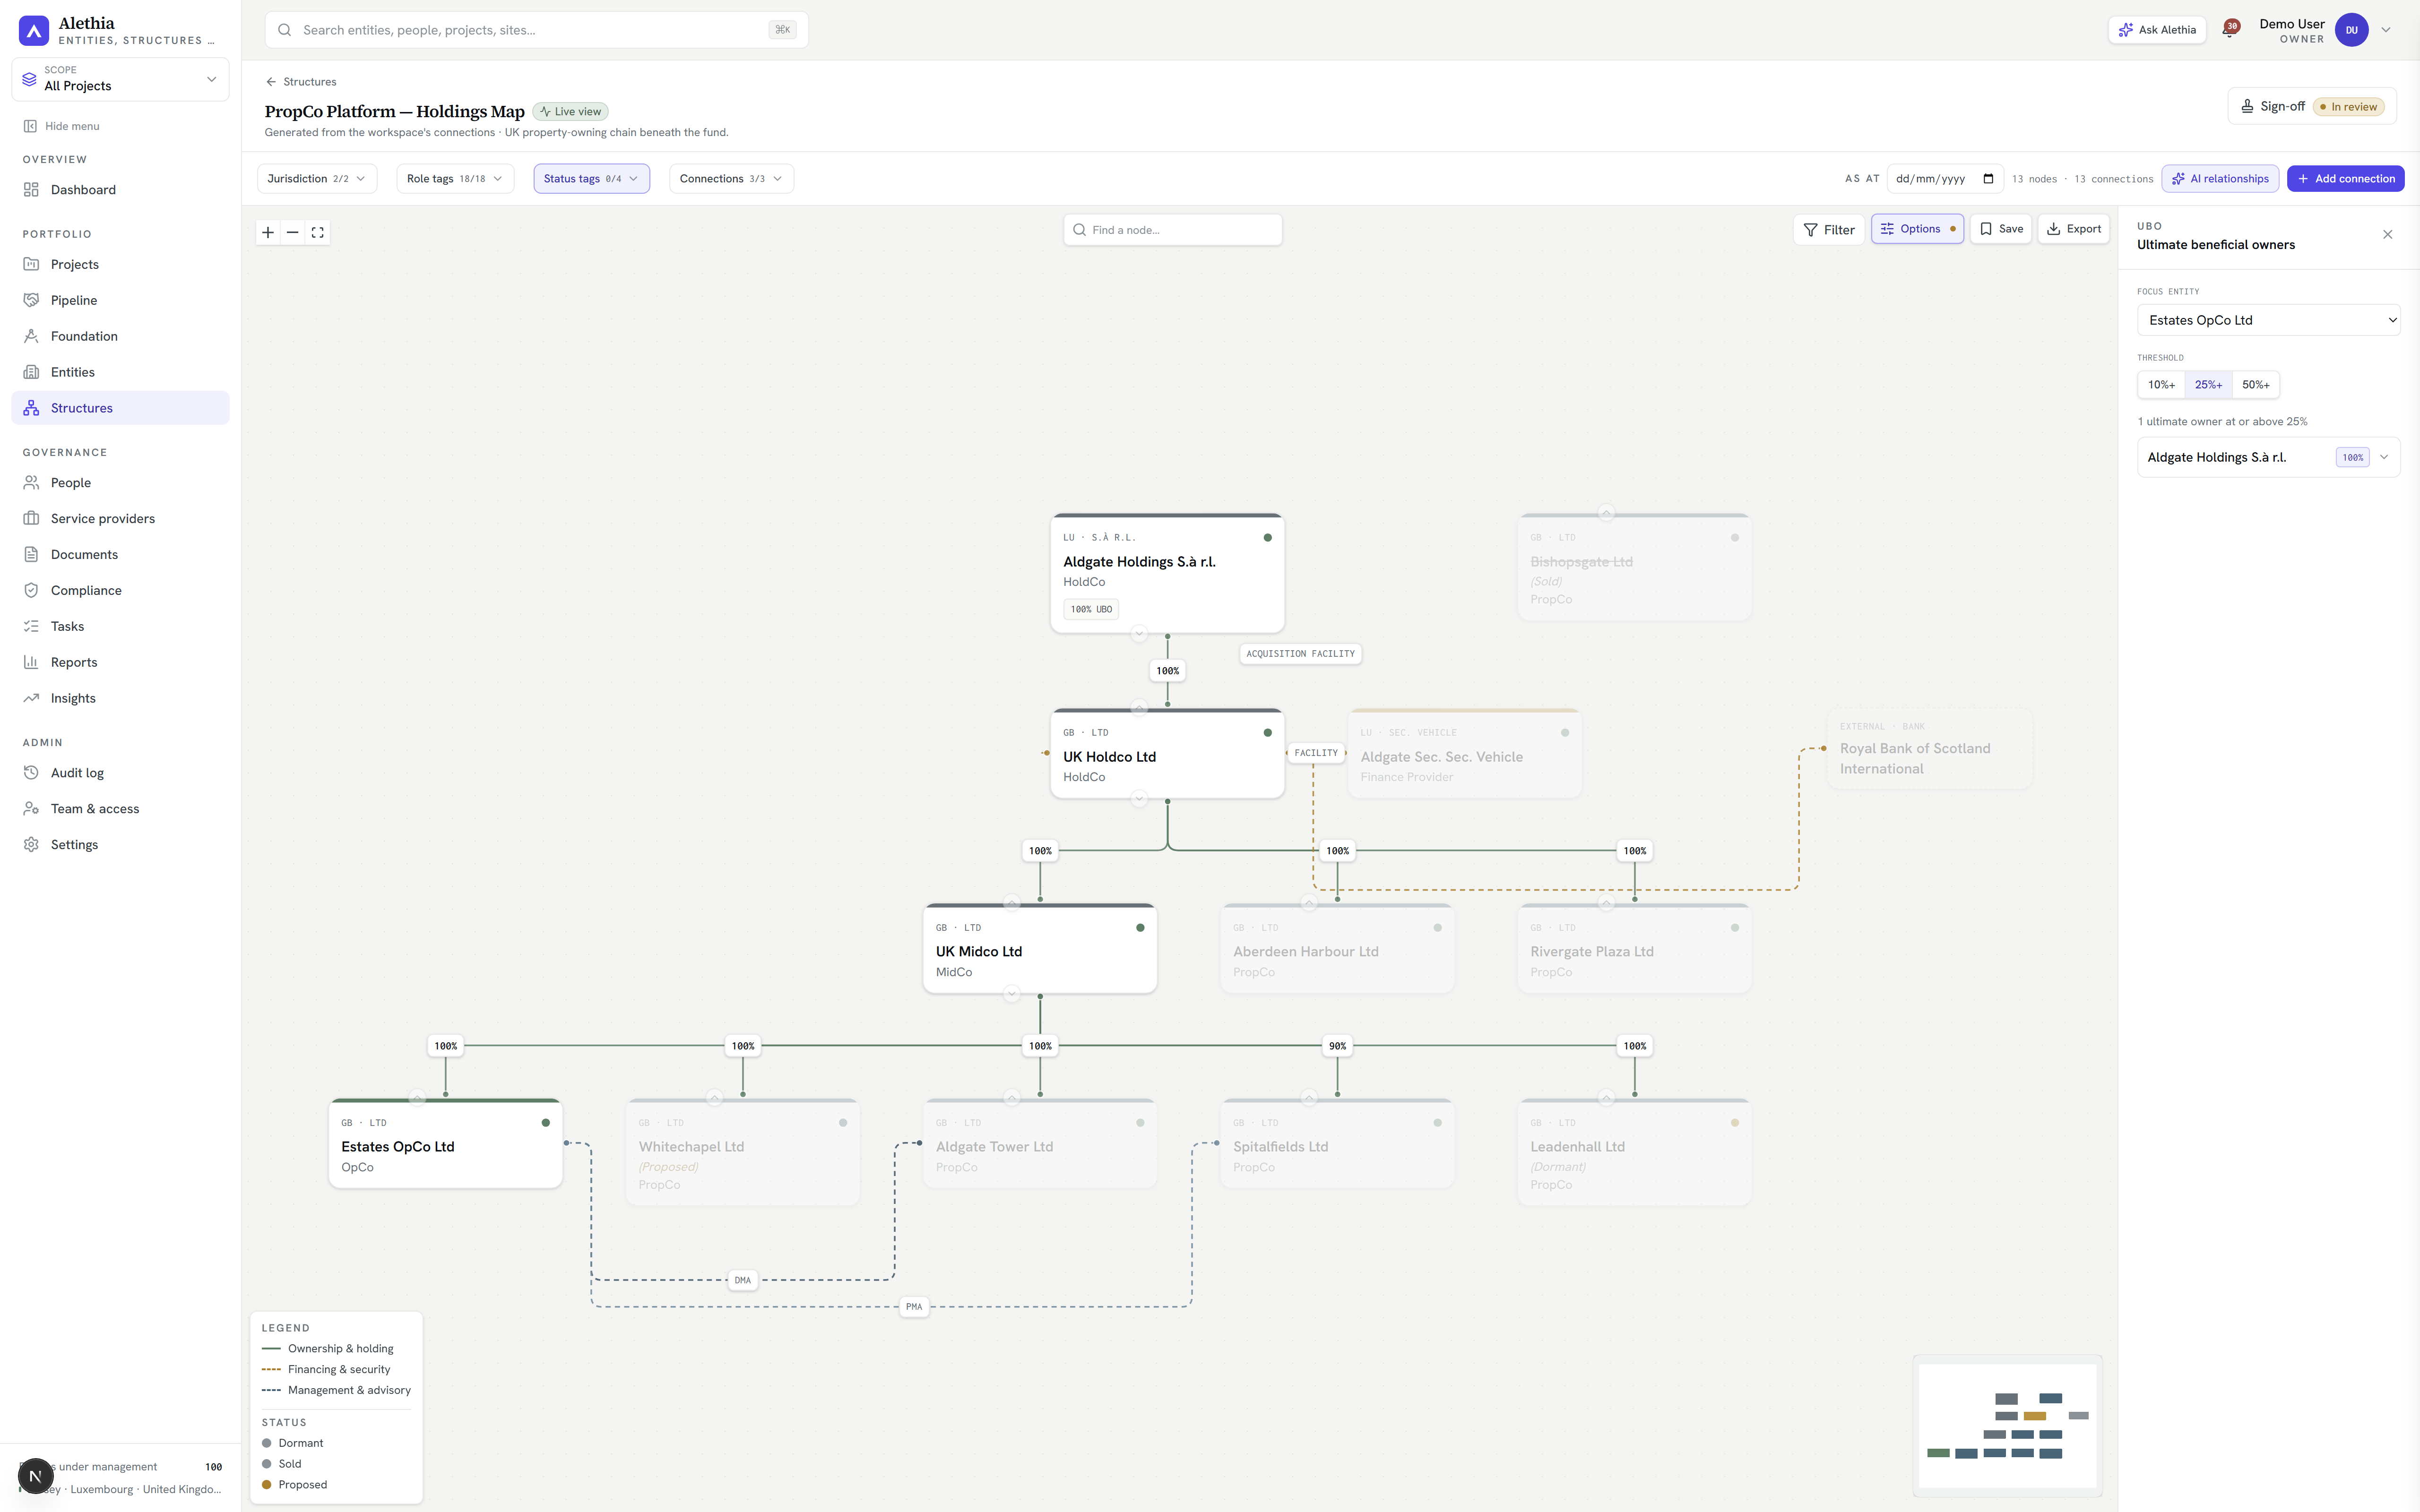
Who ends up owning it, at the threshold you set.
Pick a focus entity and a threshold, and the panel walks the ownership records to the owners above it. The answer comes from the same interests the chart is drawn from.
At scale
The product does not slow down as your portfolio grows.
- 51
- records read to open the register, the same whether you hold 100 entities or 3,000.
- 1
- read to open any of the 17 report tabs measured, however large the workspace has grown.
- 24
- records read before an entity record shows its detail, at either size.
The whole group
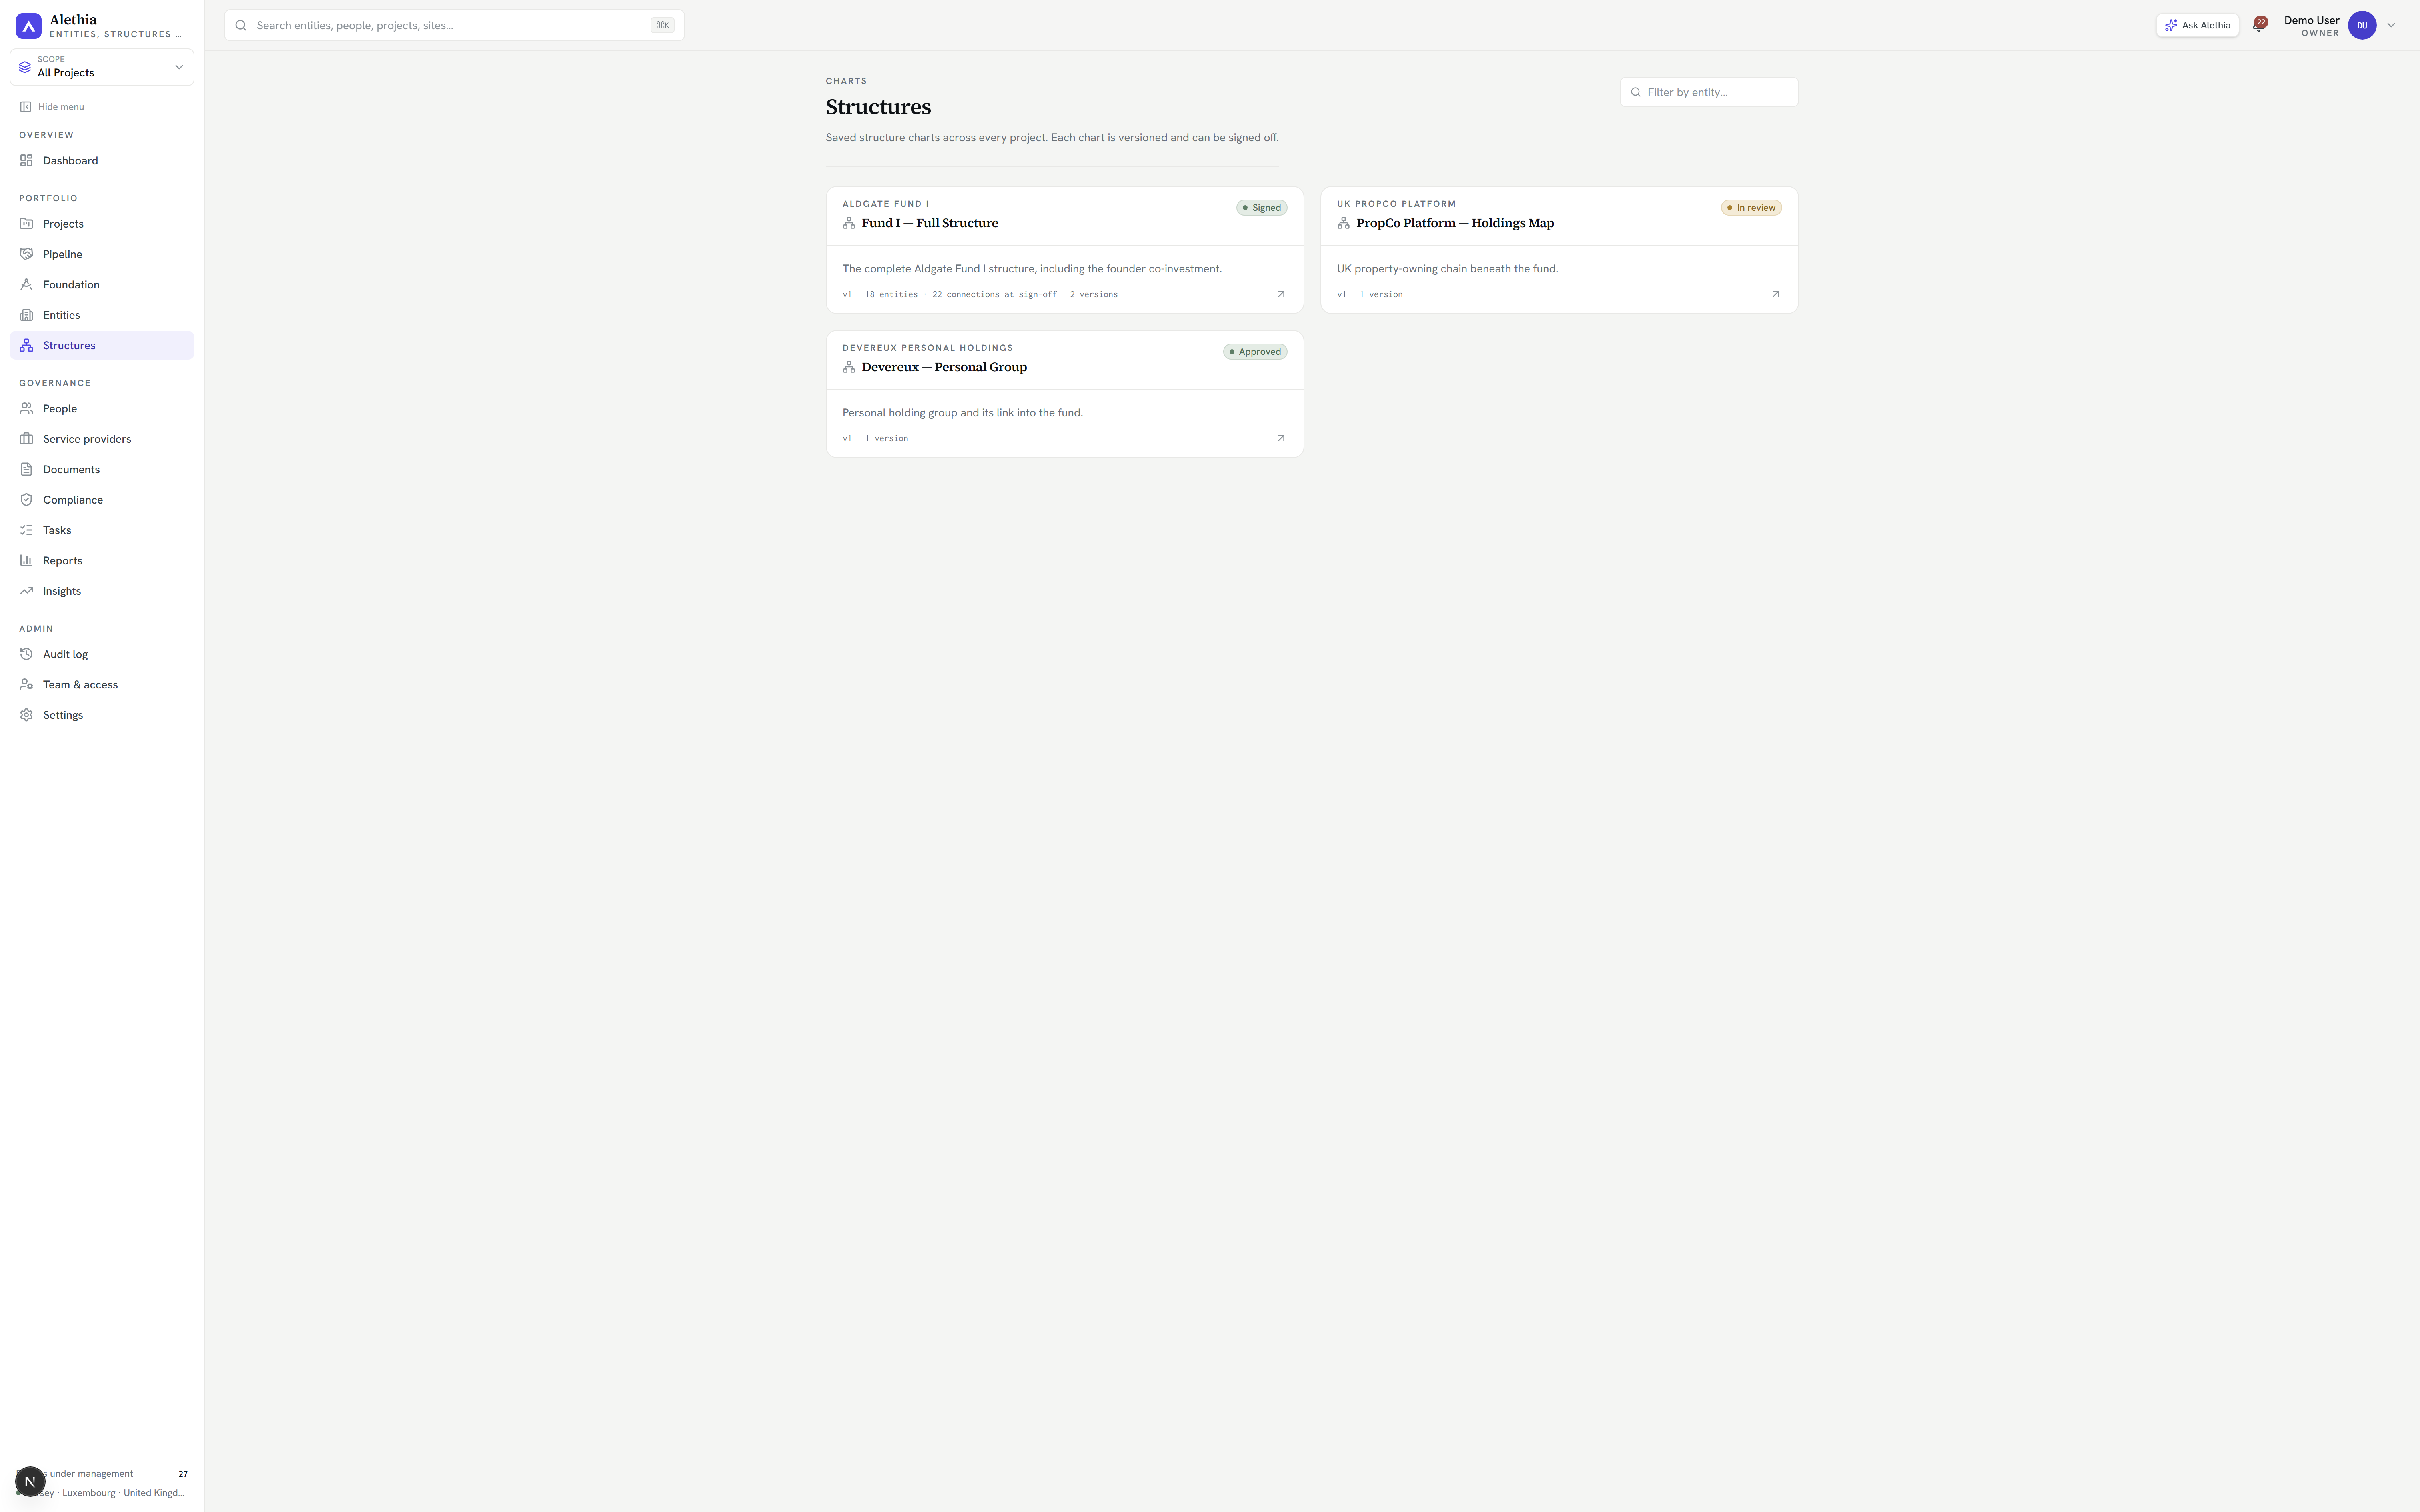
Thirteen nodes and the lines between them.
- 13 nodes · 13 connections
- Ownership, management and financing as three line styles
- Export to PDF, PowerPoint and Excel
Bases, dates and export
Three things the chart asks you to choose.
Which basis: legal, voting or economic, with totals checked per basis, so a carry vehicle and a part-held SPV read correctly. Which date: the chart can be drawn as at any date, and a named version captures a structure at a point in time. Which format: charts export to PDF, PowerPoint and Excel with the routing you see on screen, so a board pack uses the current structure rather than a copy of it.
Questions
What is structure chart software?
Structure chart software draws the ownership and control relationships between the legal entities in a group (funds, GPs, holdcos, propcos and SPVs) as a diagram. Alethia generates that chart from your live entity and ownership register rather than from a drawing someone maintains by hand, so the chart is always consistent with the underlying data.
Does the chart update when the underlying data changes?
Yes. The chart is a view of the register, not a separate artefact. Add an entity, change a shareholding or record a new appointment and the chart reflects it — there is no second copy to keep in step. You can also save named versions of a chart to capture a structure as at a point in time.
Can it show legal, voting and economic ownership?
Yes. Ownership is held by basis (legal, voting and economic) and the chart can show interests on the basis you choose, with totals checked per basis. Multi-parent holdings and part-held SPVs are drawn correctly rather than forced into a single tree.
Can I export a structure chart to PowerPoint or PDF?
Yes. Charts export to PDF, PowerPoint and Excel with the same clean routing you see on screen, so a board pack or IC memo uses the current structure directly. Jurisdiction groups, depth controls and per-view styling carry through to the export.
Does it handle large, multi-jurisdictional groups?
Yes. Jurisdiction groups gather entities by jurisdiction, depth controls fold and reveal branches, and filters isolate a fund, an asset or a workstream — so a group of hundreds of entities stays legible instead of collapsing into a tangle.
Book a 30-minute initial call.
A first conversation, not a workshop. We show you the product on the demo workspace, answer your questions and tell you plainly whether it fits your structure.